Growing are the city centre, the semi-central districts, and several high-quality hillside microzones. La Pigna and some less dynamic areas are losing ground. The city is not accelerating evenly: it is becoming more hierarchically differentiated.
by Luigi Ragone
Analysis of OMI property values by microzone in the Municipality of Sanremo between the second half of 2024, the first half of 2025, and the second half of 2025
The latest update from the Real Estate Market Observatory of the Italian Revenue Agency, when read through a micro-territorial lens, shows that Sanremo is not experiencing a broad-based phase of growth, but rather a more sophisticated process of selective realignment. Areas with stronger urban legibility, greater residential desirability, and higher expected liquidity are strengthening their position. Others, by contrast, are declining or stagnating. The real point is not simply that values are rising or falling in absolute terms, but that the market is once again differentiating more sharply from one area to another.
Moderate growth, but far from widespread
If, for each microzone, one takes the benchmark residential property type indicated in the OMI legend and uses the midpoint of the sale-value range as a synthetic indicator, the overall picture points to only moderately expansionary dynamics.
Indeed, the simple average of the midpoint values of the microzones considered rises from approximately €1,983.8 per square metre in the second half of 2024 to €1,991.2 in the first half of 2025, and then to €2,029.4 in the second half of 2025.
Translated into economic terms:
- the year-on-year change between the second half of 2025 and the second half of 2024 is approximately +2.3%
- the half-year-on-half-year change between the second half of 2025 and the first half of 2025 is approximately +1.9%
It would, however, be a mistake to stop at the average figure. In this case, the average dilutes the real story. And the real story is that Sanremo’s property market is not growing across the board. Rather, it is selecting.
On a year-on-year basis:
- 6 microzones are rising
- 3 are declining
- 8 are stable
On a half-year basis:
- 6 microzones are rising
- 2 are declining
- 9 remain unchanged
We are therefore not looking at a phase of generalized expansion, but at a redistribution of value within the city.
Where the market rewards: centrality, urban quality, recognizability
The strongest dynamics are concentrated in areas that possess at least one of the following features: functional centrality, perceived urban quality, proximity to services, residential appeal, or greater marketability of the housing product.
The strongest year-on-year performance is recorded in the lower part of the old town, up to Viale Matteotti and the Casino, where the midpoint value rises from €1,675 to €1,875 per square metre, an increase of €200, equal to +11.9%. Even more interesting is the half-year figure: compared with the first half of 2025, the increase is +15.4%. This is the strongest signal in the entire sample and indicates a marked repositioning of a central microzone which, starting from relatively lower values, appears to have intercepted new demand.
Also very strong is the performance of the first hillside belt from Via D’Annunzio and the upper part of Via Padre Semeria to the municipality’s western boundary, which rises from €2,500 to €2,750 per square metre, with a year-on-year increase of +10.0%. Here, the entire movement is concentrated in the latest survey, suggesting a recent revaluation of the microzone, likely driven by demand for residential quality, views, privacy, and a stronger overall residential profile.
The area from Corso Imperatrice to the Foce district and Corso Inglesi instead confirms more structured and linear growth, from €2,850 to €3,100 per square metre, equal to +8.8% year-on-year and +2.5% half-year-on-half-year. It is one of the areas that most clearly expresses the strength of established locations: not only prestige, but also continuity of demand.
A good result also emerges for Corso Cavallotti, Via Mazzini and the surrounding side streets, where the midpoint value rises from €2,250 to €2,425 per square metre, recording +7.8% year-on-yearand +5.4% half-year-on-half-year. The economic reading is clear: well-served urban segments, easily understood by buyers and with relatively rapid absorption, maintain a solid market premium.
The city centre—Via del Castillo, Rondò Garibaldi, Via Volta as far as Via Borea, Rondò Francia, Piazza Cassini and Porto Vecchio— also remains on a growth path, rising from €2,800 to €3,000 per square metre, with a +7.1% annual variation and +3.4% in the latest half-year. This is far from a marginal figure: the city’s urban core continues to exert strong appeal, a sign that accessibility, image, services, and market liquidity remain decisive factors.
More contained, though still positive, is the trend in the first coastal belt from Torrente Foce to the municipality’s western boundary, where values rise from €2,400 to €2,425 per square metre, equal to +1.0% year-on-year and +2.1% half-year-on-half-year. Here, the data point more to consolidation than to acceleration.
Where the market is retreating: the case of La Pigna and the microzones to watch
The most evident declines are concentrated in areas which, although potentially rich in identity, appear more difficult to absorb or less immediately legible to the market.
The weakest figure concerns the ancient core of La Pigna, where the midpoint value falls from €1,625 to €1,500 per square metre, with a year-on-year decline of -7.7% and a half-year decline of -6.25%. The economic significance is considerable, because this double negative signal reduces the likelihood that this is merely a statistical fluctuation. Rather, a more structural fragility seems to be emerging: the area’s historical and identity value, on its own, does not automatically translate into real estate value unless accompanied by greater accessibility, widespread regeneration, ease of use, and a reduced level of risk as perceived by buyers.
Also declining is the first hillside belt from Via Goethe to Via Galileo Galilei, Borgo Tinasso, which falls from €1,575 to €1,475 per square metre, with a year-on-year decline of -6.35% and a half-year decline of -4.84%. Here too, the movement is consistent in both time directions and therefore deserves attention.
More limited, but still significant, is the correction in the microzone west of Capo Verde, Via Mazzini and the surrounding side streets, where the midpoint value falls from €2,750 to €2,675 per square metre, marking a -2.7% year-on-year variation, while the half-year figure appears broadly stable. This suggests that the adjustment largely occurred in the first half of 2025, without further deterioration in the latest survey.
The broad area of stability: the market does not punish, but neither does it revalue
A very large part of the municipal territory remains substantially unchanged. No significant variations are recorded in:
- east of Capo Verde, the settlement of Bussana and the coastal strip up to the municipal boundary
- the hamlet of Poggio
- the first hillside belt from Via Galileo Galilei to Via D’Annunzio and Borgo Opaco
- the Coldirodi core
- the intermediate hillside belt
- the valleys of Torrente San Francesco and Rio del Ponte
- Valle Armea
- Valle Rio Fonti, Bussana Vecchia and Cascine Lunaire
From the standpoint of real estate analysis, even the absence of change is informative. These microzones do not appear to be undergoing either a revaluation phase or a genuine downturn. They simply remain outside the most active portion of the redistribution of value.
A dual market, not a uniform one
The most interesting feature of the Sanremo picture is that territorial differences are becoming more pronounced. In technical terms, one may speak of a greater dispersion in locational returns. The market is increasingly rewarding urban contexts that are more legible and liquid, while remaining more cautious—or weaker—where the housing product is less standardized, less immediately usable, or located in contexts requiring broader territorial upgrading.
This pattern is typical of mature markets. When demand becomes more selective, the value of “the city” does not increase indiscriminately; rather, the value of certain parts of the city rises. The others, at best, hold their ground. Sometimes they decline.
Sanremo today seems to be moving in precisely this direction.
Year-on-year and half-year changes: why the distinction matters
To understand the quality of market movement, it is essential to distinguish between year-on-year and half-year changes.
The year-on-year change compares the second half of 2025 with the second half of 2024. It is used to capture the annual trajectory.
The half-year change compares the second half of 2025 with the first half of 2025. It is used to understand whether the trend has strengthened or weakened in the very short term.
The strongest microzones are those showing both positive signals: not only are they growing on an annual basis, but they also confirm growth in the latest observation. This applies to:
- the lower part of the old town up to Viale Matteotti and the Casino
- the first hillside belt from Via D’Annunzio and the upper part of Via Padre Semeria to the western boundary
- the area from Corso Imperatrice to the Foce district and Corso Inglesi
- Corso Cavallotti, Via Mazzini and the surrounding side streets
- the city centre up to Porto Vecchio
- the first coastal belt from Torrente Foce to the western boundary
Conversely, the weakest microzones are those showing deterioration both year-on-year and half-year-on-half-year, such as:
- the ancient core of La Pigna
- the first hillside belt from Via Goethe to Via Galileo Galilei, Borgo Tinasso
This distinction is crucial, because it makes it possible to separate simple adjustments from what appear to be genuine trajectories.
Forecasts: in 2026, more consolidation than acceleration
Forecasting the property market—especially when based on OMI data rather than notarial transaction prices—must remain cautious. That said, a reasonable projection can be formulated.
The most likely scenario for 2026 is one of selective consolidation. Microzones that have shown a coherent positive trajectory should retain relative strength, though probably at a slower pace than that observed in the latter part of 2025. In particular, the city centre, the area from Corso Imperatrice to the Foce district and Corso Inglesi, Corso Cavallotti and Via Mazzini, as well as the higher-quality western hillside belt, appear likely to remain at the top of the city’s hierarchy.
More fragile, by contrast, is the outlook for the microzones that have displayed a double decline, especially the ancient core of La Pigna and the first hillside belt from Via Goethe to Via Galileo Galilei, Borgo Tinasso. In the absence of urban regeneration measures, improved accessibility, and stronger effective demand, these areas risk remaining under relative pressure.
For the stable microzones, the most plausible outlook remains one of sideways movement, unless external events or targeted initiatives succeed in reactivating the perception of value.
The latest OMI update does not portray a Sanremo property market expanding uniformly. It tells a more interesting and, analytically, more useful story: a city in which value tends to concentrate in urban contexts perceived as more solid, more liquid, and more desirable.
The point, then, is not merely that some property values rise while others fall. The point is that the geography of value is becoming more selective. And in selective markets, territory matters even more: location matters, accessibility matters, the quality of the context matters, ease of use matters, and the perception of risk matters.
Sanremo, in other words, is not today a market that rewards everything. It is a market that chooses.
Key figures
Simple microzonal average
- Second half of 2024: €1,983.8/sq m
- First half of 2025: €1,991.2/sq m
- Second half of 2025: €2,029.4/sq m
Aggregate changes
- Year-on-year 2025/2 vs 2024/2: +2.3%
- Half-year 2025/2 vs 2025/1: +1.9%
Best year-on-year performances
- Lower part of the old town up to Viale Matteotti and the Casino: +11.9%
- First hillside belt from Via D’Annunzio / upper Via Padre Semeria to the western boundary: +10.0%
- From Corso Imperatrice to the Foce district and Corso Inglesi: +8.8%
- Corso Cavallotti, Via Mazzini and the surrounding side streets: +7.8%
- City centre up to Porto Vecchio: +7.1%
Worst year-on-year performances
- Ancient core of La Pigna: -7.7%
- First hillside belt from Via Goethe to Via Galileo Galilei, Borgo Tinasso: -6.35%
- West of Capo Verde, Via Mazzini and the surrounding side streets: -2.7%
Year-on-year change (Second Half 2024 vs Second Half 2025)
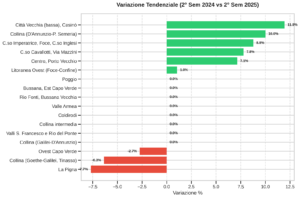
The year-on-year analysis highlights a polarized market dynamic. Growth is led by the lower part of the Old Town towards the Casino (+11.9%), closely followed by the high-end hillside areas (Via D’Annunzio–Padre Semeria, +10.0%) and by well-established prime districts such as Corso Imperatrice (+8.8%). This suggests strong upward pressure on prestigious areas and on locations subject to potential urban regeneration or strong tourism-oriented appeal. By contrast, the historic core of La Pigna (-7.7%) and the Borgo Tinasso hillside area (Goethe–Galilei) (-6.3%) are recording depreciation, likely reflecting structural weaknesses or lower accessibility.
Half-year change (First Half 2025 vs Second Half 2025)
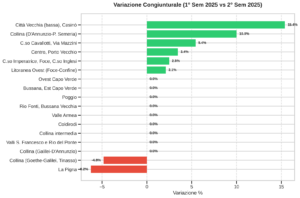
The half-year trend confirms an acceleration in the second half of 2025 for Sanremo’s prime microzones. Particularly striking is the +15.4% jump in the lower Old Town compared with the previous half-year, which had shown a slight decline: this points to a sudden positive demand shock or the completion of regeneration-related improvements. The city centre and Porto Vecchio (+3.4%) also perform well. The speed with which these values have repriced indicates a market highly responsive to seasonal dynamics and investment flows in the second half of the year. The half-year declines, on the other hand, confirm the structurally negative trend for La Pigna and the Via Goethe area.
The 5 microzones with the strongest year-on-year growth
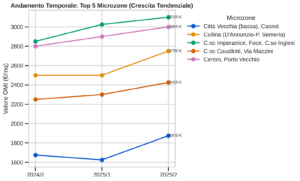
This graphical snapshot illustrates the strength of the rebound in the top-performing zones. It is particularly notable that Corso Imperatrice and the Historic Centre/Porto follow a linear and steady upward trajectory, a sign of “safe haven” assets with high reliability. By contrast, the line for the Old Town/Casino area has a V-shape, indicating greater volatility but also a very strong final recovery that brought it close to €1,900/sq m.
The 3 microzones with the weakest performance
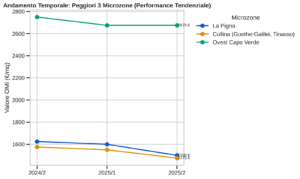
The three microzones in negative territory show different paths. While the western Capo Verde / Via Mazzini areaexperienced a downward adjustment already at the beginning of 2025 and then stabilized—remaining, however, at still very high values of €2,675/sq m—La Pigna and Borgo Tinasso show a progressive erosion of value across all half-year periods, falling below the €1,600/sq m threshold. These areas would likely require targeted incentives to attract new investment and reverse the trend.
Ranking of property values (Second Half 2025)
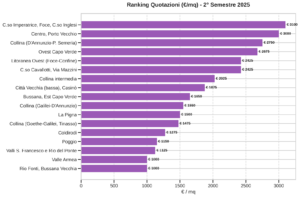
The picture of absolute values at the end of 2025 confirms the hierarchy of Sanremo’s real estate prestige. The prime market comfortably exceeds the €3,000/sq m threshold, with the undisputed leader being the Corso Imperatrice–Foce–Corso Inglesi axis (€3,100/sq m), closely followed by the city centre and Porto Vecchio (€3,000/sq m). At the opposite end, the map highlights the affordability of the inland valleys—Valle Armea, Rio Fonti and Bussana Vecchia, all standing at €1,000/sq m—revealing a value gap of more than 200% between the peripheral hamlets and the seafront promenades.
Market status summary (Year-on-year change)
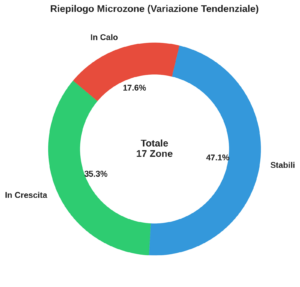
The overall picture shows a Sanremo property market that is mainly in a phase of strategic consolidation. 41.2% of the microzones have maintained perfectly stable values, acting as a stabilizing buffer for the market as a whole. However, the same share—41.2%—is expanding, a sign that active transactions are pushing prices upward where quality supply meets demand. Only a minority, 17.6%, show declining values, confining the weaknesses to specific enclaves without undermining the citywide resilience of the sector.
Luigi Ragone